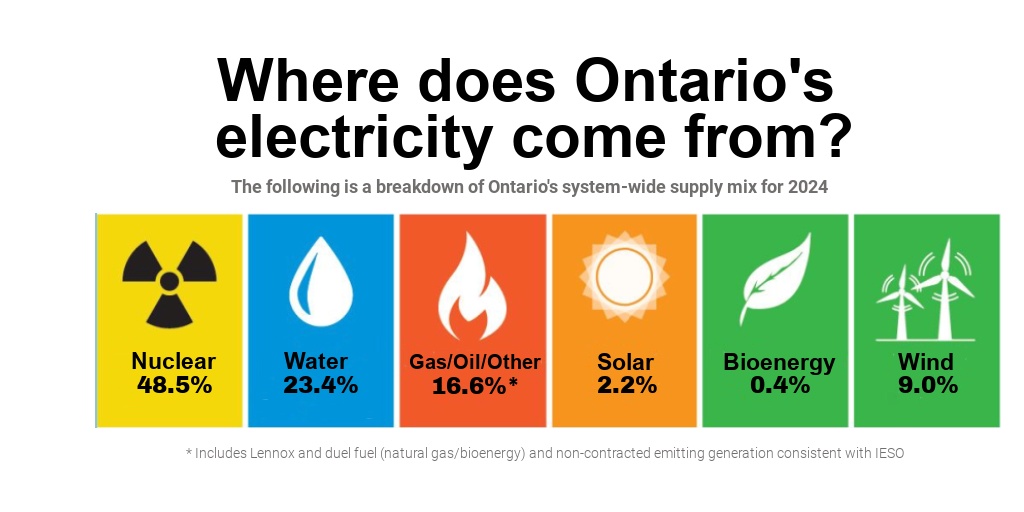
Under O. Reg. 416/99 the Ministry of Energy is responsible for providing Ontario’s electricity supply mix data for electricity suppliers. The following table discloses the system-wide electricity supply mix data for 2024. This data must be used by electricity suppliers for the purposes of complying with the disclosure obligations of O. Reg. 416/99 and the Directive. This data should be considered current until further notice.
| 2024 Electricity Facts | |
| Electricity Sources | Ontario’s Electricity Mix |
| Nuclear Energy | 48.5% |
| Waterpower | 23.4% |
| Natural Gas*/Oil/Other | 16.6% |
| Wind | 9.0% |
| Solar | 2.2% |
| Bioenergy | 0.4% |
| * Includes Lennox, dual fuel (natual gas/bioenergy) and non-contracted emitting generation consistent with IESO. | |
| Note: | |
| 1. Figures may not add to 100% due to rounding. | |
| 2. Figures do not account for the sale and retirement of Clean Energy Credits (CECs). | |
To fulfill the requirements of the Regulation, the OEB presents the information in percentages. To support the changes the IESO has made to the presentation of their distribution-connected data, the supply mix data in the table below is also presented in Terawatt-hours (TWh).
| 2024 Electricity Facts | |||
| Ontario’s Electricity Mix | |||
| (System-wide Generation in terawatt-hour – TWh) | |||
| Electricity Source | Tx-Connected (direct) | DX-Connected (embedded) | Total |
| Nuclear | 80.00 | – | 80.00 |
| Waterpower | 37.80 | 0.80 | 38.60 |
| Natural Gas*/Oil/Other | 24.70 | 2.70 | 27.40 |
| Wind | 13.40 | 1.40 | 14.80 |
| Solar | 0.70 | 2.90 | 3.70 |
| Bioenergy | 0.30 | 0.20 | 0.60 |
| Total | 156.90 | 8.10 | 165.00 |
| * Includes Lennox, dual fuel (natural gas/bioenergy) and non-contracted emitting generation consistent with IESO. | |||
| Note: | |||
| 1. Components may not sum to the total due to rounding. | |||
| 2. Figures do not account for the sale and retirement of Clean Energy Credits (CECs). | |||

